AWS Cloudwatch is one of those products that initially looks very scary to deal with. Whole bunch of data, metrics, dashboards, analysis.Wait...sounds like now we are talking finance and not cloud.
But, if you play around with it, fundamentally Cloudwatch works on simply three major principles.
1. Metrics
2. Logs
3. Events
Think of it as a security guard, on duty 24/7 watching your house and if any single component stops working or gets damaged, instead of waking you up in the middle of the night, it will sound an alarm and it will take action doing all this while simultaneously writing a detailed report.
Well, on a very high level that's the idea. Cloudwatch is extremely customizable and one of its key metric is well, a Metric. And that's what we're going to talk about today. Metrics are like triggers that you define. You can either choose from a predefined list of metrics that AWS has to offer or, you can write you own custom metric using AWS CLI or via an API.
A particular metric can be defined for multiple similar resources grouped in one. This is useful when you want to monitor specific type of products. You can define a billing metric to save costs, which by the way you should do as soon as you signup for the AWS console.
To put it simply in a lay mans terms it equates to If this happens, then sound an alarm, alert me and take this action, if not, just be OK.
But then, its not just a reactionary tool. Somewhere down the line it evolved into constant analysis of the metrics which also makes is a proactive security tool.
This is useful in so many scenarios. For e.g. I have a metric setup for billing. And my Metric is, if my account billing ever goes above $5 then sound an alarm and send me a notification.
Similarly for resources on aws, you could say, if my server (instance in AWS terms) is experiencing issues then sound an alarm, send me an alert and take action by automatically creating an exact same instance or two or how many you define so the end customer doesn't face any hindrance in service.
Cloudwatch can run on AWS resources as well as on premise servers
Today, we're going to focus on how to setup a Metric. The good thing about a Metric is, it can be defined at a resource "component" level. In this case, we're going to say, if CPU utilization goes above a certain% then sound an alarm, using that alarm as a trigger it can be programmed to take certain actions.
That's the beauty of Cloudwatch, every action you can define is completely optional. Meaning you dont have to go all the way, if you want, you could just stop at an alarm stage. Amazon by default uses Cloudwatch on some of the resources on your console to constantly analyze the metrics. Although Cloudwatch is a free product upto a point, but if you want the output, the data logs to be more granular and improved monitoring then it becomes a paid service. For us, lab users, the free data points it provides are more than enough
The reason I wanted to show this lab is because, a lot of times when you have a Metric such as CPU utilization threshold, there's not a lot of ways you can exceed the defined threshold in a test environment to trigger an alarm. Especially on Linux based instances. However, now a days there seems to be an app for everything and what we will be using today is a tool called "epel" from amazon's Linux 2's repository and then, from within that package we will be installing another package simply called "Stress" to stress out the CPU.
Again, the goal here is to setup a CPU Metric as a threshold , then use the Stress tool to bypass that threshold and find out if it actually triggers an alarm...So lets dig in.
First, lets create an EC2 instance using an Amazon Linux2 AMI
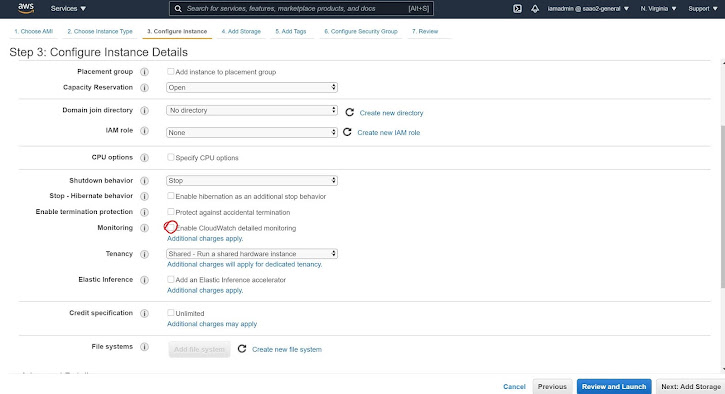
If you want a more detailed Cloudwatch monitoring, that's the checkbox for your EC2 instance. But, its gonna cost you. I would say maybe had I checked for this session I was looking around $0.005 or something like that. To put into perspective I'll have to run 10,000 metrics to get billed $0.30 which tells me, for big enterprise users, that amount of analysis can be exhausted in a millisecond?
Lets launch the instance by using all the default settings.
Now, copy the EC2 ID of the newly launched instance from the instances "Monitoring tab". Notice, this tab is a direct feed from the Cloudwatch itself. You should see graphs here based on various hardware Metrics. Simply double click on one of them and copy the ID. Were going to need that to pick a Metric and create an alarm
Go on top in the search bar look for Cloudwatch. Although I prefer to have Cloudwatch open in a different tab to keep me from shuffling back and forth. Ok, Lets create an Alarm now.
On the left panel, you should see a subheading called "Alarms" Go ahead an select that and hit that "Create Alarm" box
Here, you can see I already have a billing Alarm setup which is in an "OK" State. I should mention that an alarm usually is always in either one of these three stages, "OK", "ALARM", "INSUFFICIENT DATA".
The latter is quite common in scenarios where you have just defined metric and created the alarm, and the refresh cycle hasn't been completed. We will see more on that below.
Select a Metric that you want to gauge on:
Under the All Metrics tab, narrow down the metrics by the EC2 ID. This is where the EC2 ID which we copied earlier can be pasted in the search bar as seen below. Its especially helpful if you have multiple instances running and you only want to monitor a select few., the ID acts as a filter. Although if you want to monitor all your instances you also have the option of select all. But for now lets stick with the filter of just one instance.
For the resource type EC2 Instance, you can already see there are numerous amounts of predefined metrics that can be used, we're going to choose CPU utilization as a metric from that list.
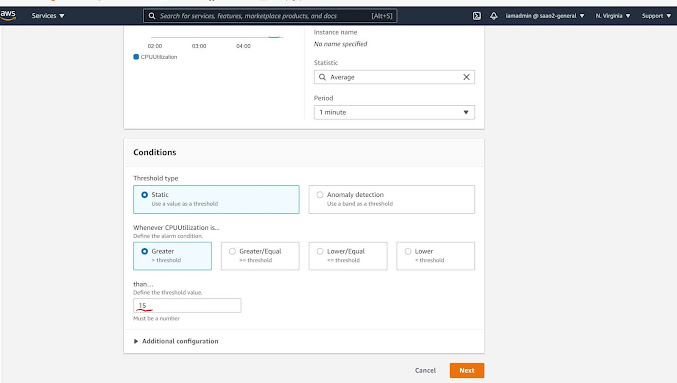
Some key things to note here, you can see the instance ID we selected above. We are using a threshold of Average CPU Utilization hence the statistic is defined as "Average".
The field "Period" indicates, the interval of time you'd like Cloudwatch to monitor for this metric. I selected 1 minute for this test which is the lowest value possible. But in an enterprise environment, I would think that wouldn't be a best choice if you have 500+ instances running. This interval period is also the main reason you would see insufficient data because of that "Pull" interval timing.
IF you scroll down a bit, this is where you get to define the Threshold. I want my threshold to be static, and my argument here would be "Greater than" value 15. Which denotes to 15% . So I am essentially telling Cloudwatch, that if my CPU Utilization is higher than 15% then trigger an alarm.
This is the part were you define the state in which you would you like to be notified. Obviously, I would like to be notified when it goes into be in an alarm State. If you have already defined an AWS SNS (Simple Notification Service), then you can pick that list from the field below. Remember, an SNS list consists of email ID's Multiple emails and its what AWS like to call a "Pub-sub" model, lets keep that for another blog. For me, in this Demo, I had no need for notification so I simply used the "Remove" button on the top right to bypass this.
Time to define a name for this Alarm and create it.
After the Alarm is set a red line on the graph can be seen now, which is static at 15 indicating the threshold I defined. The Alarm state is now in "OK" mode because my CPU utilization is waay down there. The Data point is in decimals, its that low. Lets change that now, it needs some using :)
Ok, time to stir up things and wake up that CPU so we can see if it can trigger an alarm. Its time to log into the instance.
On the EC2 instance page, select the instance we just created and copy its Public IP address from the metadata details tab below. We will need that to ssh into the instance. Once its copied, go ahead and hit connect on the top. You should see a prompt asking if you want to use the existing secret key to login or create a new key pair. Go with your choice.
As some of you might know very well, there are numerous ways to SSH into a linux machine. Putty, AWS CLI, Linux command line if you are on a mac, Ubuntu. However, since I am a Windows user I could very well use AWS CLI via command prompt but I prefer using Windows powershell. I guess its all about blue vs black screen to me. You should know though, not all powershell CLI's are capable of SSH. The best thing is to check it before you start typing commands. To check if its compatible, simply type the command
ssh
And if you get the following response then you're all set!
There are slightly different commands to ssh into the terminal. I prefer to use the following:
ssh -i C:\Users\imran\Documents\myfirstec2instance.pem ec2-user@54.234.212.148
To simply translate, ssh= linux remote connection protocol, -i is saying I am using my identity file to login. This file is the private key file that you generate right after you click connect, or you can use the previously generated file. The directory path is simply pointing to the private key file which has a .pem extension.
The final part of this string indicates the user name for Amazon Ec2 instances, which by default is always ec2-user followed by the public IP address of the instance. Once you hit enter and see this sort of a welcome screen then it means you've successfully logged into to the instance. Note, that I have a red pointer, its always a best practice to run that update command to make sure your Amazon Linux AMI is up-to date with all the repositories.
And now finally the part I was waiting for. Time to install "epel" package from the repository.
To do that, simply type in
sudo amazon-linux-extras install epel -y
For all of you non linux users, allow me to break this down again. In order to install or update anything in linux, you need to have an admin access. "sudo" simply implies you are going to install epel from the amazon-linux repository as a super user/admin. The -y at the end is optional. Its simply there to bypass the "would you like to install" (yes/no) prompt. -y Implies "yes".
Once the installation is complete, time to install "Stress" package.
sudo yum install stress -y
Now were finally there. Time to stress out that CPU and trigger that Alarm. Simply type the following to run stress
stress -c 2
You should now see a new line called Stress: info: if everything went well. Stress is now dispatching hogs on your instance's CPU. The pigs should wake it up. Lets find out.
A minute later, as it can be seen below, the CPU woke right up all the way upto 54%. And that triggered the alarm state, the red exclamation "In Alarm"!
Lets wrap this up, I launched an instance, created a metric of CPU threshold of 15 or below as a desired state and setup an Alarm if the threshold increases that % of CPU utilization. To increase CPU utilization I used linux stress package to work up that CPU above 15% which in turn triggered the alarm as it was designed to do. This demo can be very useful when you're doing a lab to test out consequential automated actions based on that alarm. lets say you want Autoscaling based on CPU threshold.
This Alarm trigger can automatically initiate actions such as Scaling out and scaling in the instances.
And that's all for now.
This was a simple lab, I found it very interesting and will be using this to play around and test out numerous types of consequential actions that Cloudwatch can automatically initiate.
To conclude, if you followed this lab, do make sure to clean up. Hold cntrl+c to end the stress test on powershell. Terminate the instance. Also under cloudwatch delete the Alarm which should also delete the metric.
Until next time...


This can potentially stop hackers from leveraging compromised aws accounts in order to mine BTC... :-)
ReplyDeleteJust published the while article
Delete